Issue:
How to run a sensor history report to determine baseline values for sensor thresholds.
Product Line:
StruxureWare Data Center Expert (DCE)
- Basic Appliance (AP9465)
- Standard Appliance (AP9470)
- Enterprise Appliance (AP9475)
- Virtual Appliance (AP94VMACT)
Environment:
StruxureWare Data Center Expert (all versions)
Device Thresholds (NetBotz, APC, Third-Party)
Cause:
Every environment (temp/humanity/etc) is different, and therefore, the default thresholds should be adjusted to suit the normal, or expected, range of your environment. This method can be used for any sensor types that have a numeric number that goes up and down and alarms based on range values or maximum/minimum values.
Resolution:
1) Open the Data Center Expert desktop client.
2) Navigate into the monitoring Perspective.
3) Within the Device View pan, right-click on the device and select Generate Sensor History report. Choose the sensor type in question.
4) A report will automatically generate with data for the last 24 hours for all sensors on that device within the chosen type.
5) Below the graph, uncheck all sensors except for the one you wish to determine the baseline for.
6) Click on the Edit icon (pencil) in the upper-right, above the graph.
7) Within the Choose Date, select a larger timeframe. It is suggested to select a large time-frame, such as 30 days, to ensure that the normal ups and downs of the sensor over time are taken into account. For example, the temperature may get hotter on the weekend if you depend on HVAC to cool the room and the A/C is turned off on the weekend. Click OK when the time-frame is edited.
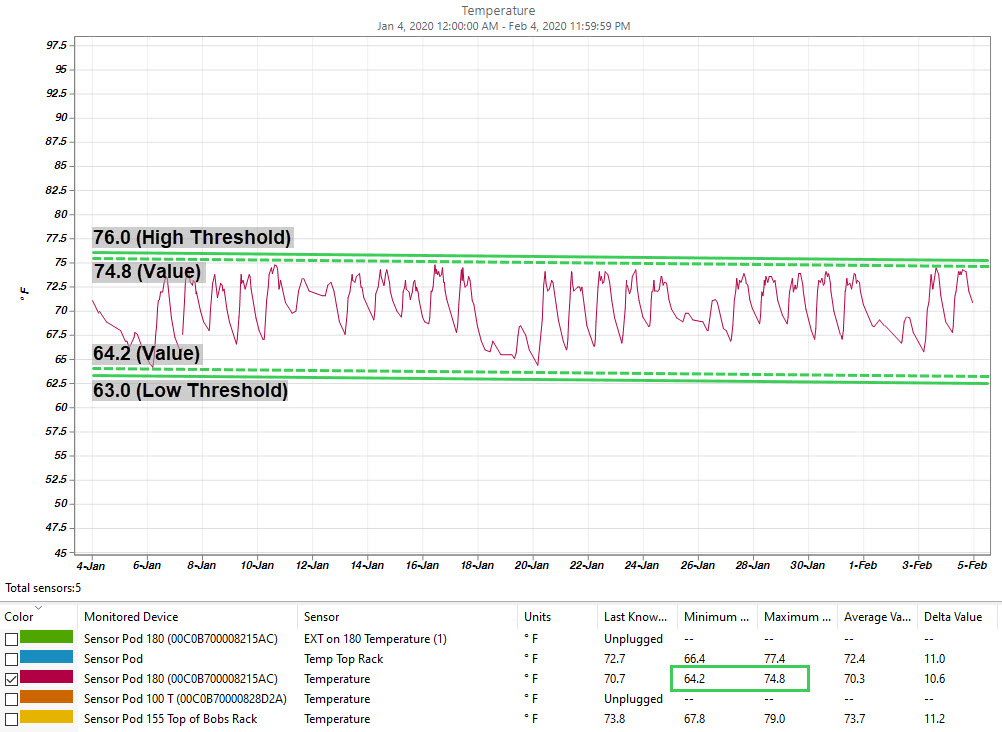
8) The graph will automatically reload. This will allow you to see the high/low values over time. Below the graph will be the numerical values for the Minimum/Maximum values during the selected timeframe. It is recommended to look closely for events on the graph that are outliers that may make these numbers outside the baseline range that you wish to determine. If you have outliers, look at the graph axis to determine what a good value is for the time-frame selected. This should help you determine a base-line that is acceptable for the current conditions of your environment.

9) Use these values to set your thresholds accordingly, whether the threshold needs to be adjusted on your device or via a custom threshold within Data Center Expert. See below for instructions on how to manage thresholds on NetBotz and in Data Center Expert.
WARNING! If you are unsure of what values to use to notify you of critical incidents, consult your local HVAC technician / Data Center technicians to determine what values your environment should be maintaining.
Information on adjusting thresholds can be found in the following FAQs:
NetBotz 250 | Adjusting Temperature/Humidity Sensor Thresholds
How do I adjust thresholds for a Netbotz within Advanced View?
NetBotz 700 Series | Configuring Alarm Thresholds and Notifications (email & SNMP Traps)
Video: Data Center Expert | How do I create and manage thresholds?
How to run a sensor history report to determine baseline values for sensor thresholds.
Product Line:
StruxureWare Data Center Expert (DCE)
- Basic Appliance (AP9465)
- Standard Appliance (AP9470)
- Enterprise Appliance (AP9475)
- Virtual Appliance (AP94VMACT)
Environment:
StruxureWare Data Center Expert (all versions)
Device Thresholds (NetBotz, APC, Third-Party)
Cause:
Every environment (temp/humanity/etc) is different, and therefore, the default thresholds should be adjusted to suit the normal, or expected, range of your environment. This method can be used for any sensor types that have a numeric number that goes up and down and alarms based on range values or maximum/minimum values.
Resolution:
1) Open the Data Center Expert desktop client.
2) Navigate into the monitoring Perspective.
3) Within the Device View pan, right-click on the device and select Generate Sensor History report. Choose the sensor type in question.
4) A report will automatically generate with data for the last 24 hours for all sensors on that device within the chosen type.
5) Below the graph, uncheck all sensors except for the one you wish to determine the baseline for.
6) Click on the Edit icon (pencil) in the upper-right, above the graph.
7) Within the Choose Date, select a larger timeframe. It is suggested to select a large time-frame, such as 30 days, to ensure that the normal ups and downs of the sensor over time are taken into account. For example, the temperature may get hotter on the weekend if you depend on HVAC to cool the room and the A/C is turned off on the weekend. Click OK when the time-frame is edited.
8) The graph will automatically reload. This will allow you to see the high/low values over time. Below the graph will be the numerical values for the Minimum/Maximum values during the selected timeframe. It is recommended to look closely for events on the graph that are outliers that may make these numbers outside the baseline range that you wish to determine. If you have outliers, look at the graph axis to determine what a good value is for the time-frame selected. This should help you determine a base-line that is acceptable for the current conditions of your environment.
9) Use these values to set your thresholds accordingly, whether the threshold needs to be adjusted on your device or via a custom threshold within Data Center Expert. See below for instructions on how to manage thresholds on NetBotz and in Data Center Expert.
WARNING! If you are unsure of what values to use to notify you of critical incidents, consult your local HVAC technician / Data Center technicians to determine what values your environment should be maintaining.
Information on adjusting thresholds can be found in the following FAQs:
NetBotz 250 | Adjusting Temperature/Humidity Sensor Thresholds
How do I adjust thresholds for a Netbotz within Advanced View?
NetBotz 700 Series | Configuring Alarm Thresholds and Notifications (email & SNMP Traps)
Video: Data Center Expert | How do I create and manage thresholds?
Released for:Schneider Electric United Arab Emirates


